
Why is Oregon Still on Lock Down?
The data reveals little to no benefit, and seismic losses
by Professor Hinkley
April 4, 2020
(Author note: after more than 50,000 reads in about 8 hours, medium.com deleted this article from their site.)
Like most areas of the world right now, my amazing community here in Portland, Oregon is absolutely suffering as job losses and crushed lives mount with each passing day.
So far, Oregonians are stepping up and doing their part to help save their fellow citizens, which is the reason we’re all sheltering in place, right? But what if the data, the data we already have, tells a different story? What if the data tells us that we never needed a lockdown, and that the COVID-19 virus is already running its course here in Oregon on its own? Most people will refuse to believe what I’m about to show you.

The mega-complex of Oregon Health Sciences University
OHSU’s data
Portland’s largest single employer is Oregon Health Sciences University with over 17,000 employees. US News & World Report voted OHSU the best hospital in Oregon, they treated over 300,000 patients last year, and currently have 562 staffed hospital beds. OHSU also has taken the rare step of publicizing all of their COVID-19 data for anyone to see, which makes it easy to determine how many Oregonians are currently hospitalized at OHSU for COVID-19. And that number, as of tonight April 4, 2020 is…wait for it…SIX.
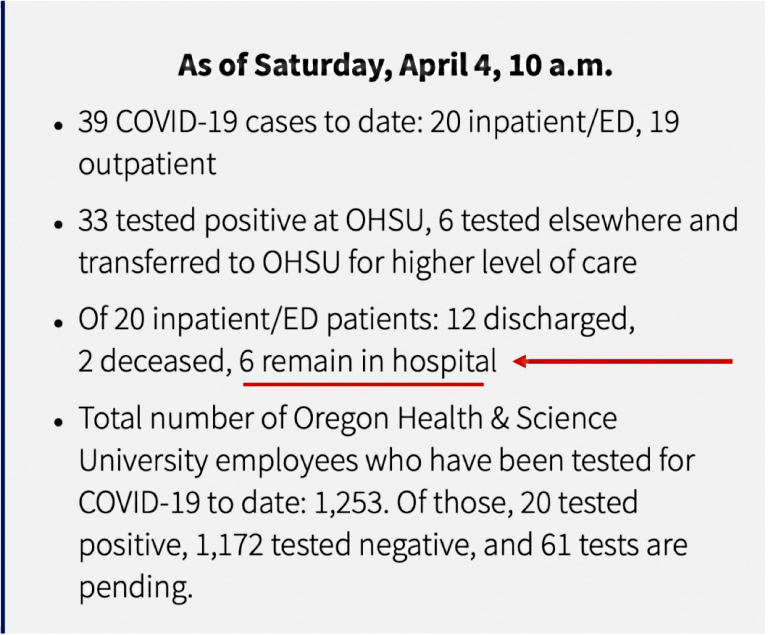
From OHSU’s website
Hospitalizations tell us everything
We’re inundated with daily tallys of the number of people who have tested positive for COVID-19. Like every state who has increased the number of tests they have given, Oregon has seen their number of positive cases rise, too, and it’s tracked every day on the Oregon Health Authority’s website. Today Oregon has 999 positive cases. And it means absolutely nothing, because there’s no standardization for how, when, or why people are tested, and if you only test people with symptoms, more likely test positive. Does Oregon’s 999 positive tests mean that 999 people in the state have COVID-19? 9,000 people? Or 900,000 people? That’s the problem, no one has any idea, which means the tests are useless for determining the most important question we all want to know:
where we are in the cycle of the disease?
Hospitalizations on the other hand, are the best data we have. We know for certain when someone goes to the hospital — and stays — for COVID-19. They are the “tip of the iceberg” of COVID-19 carriers (since we know 50% of COVID-19 carries are asymptomatic, we won’t find them until we test everyone) and if their numbers are exploding, then you know the virus is exploding in the state, too. Also, if the lockdown works, hospitalizations DECREASING should be your first sign that the lockdown is working…unless of course hospitalizations were decreasing before the lockdown could have had an impact (oh rats I just gave away my punchline, but I hope you will read on to see the data for yourself…)
Oregon’s Hospitalization Shows: COVID-19 was on its way out before the lockdown happened
Every day, the Oregon Health Authority releases new data about COVID-19. Here’s today’s released this morning at 0900. I will pull out two of the most important charts, and try to explain. Here’s the first one:
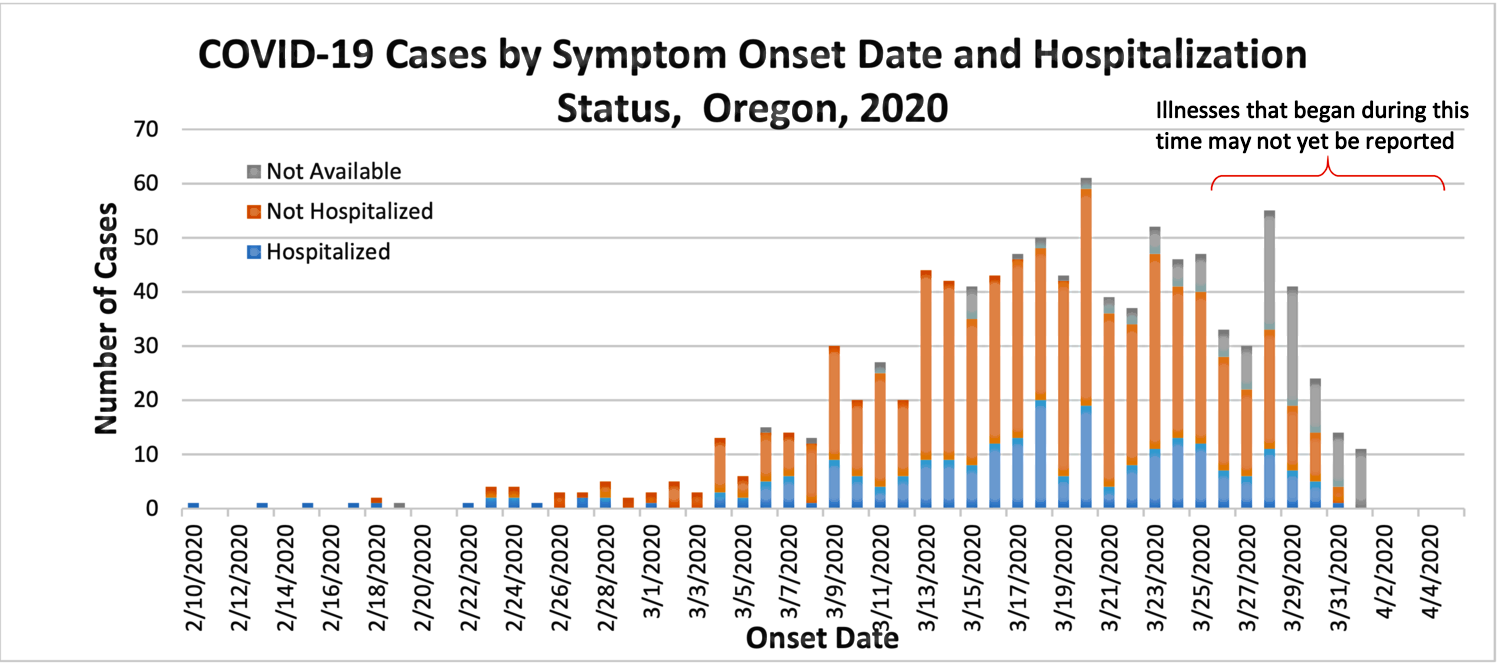
So the chart above shows us COVID-19 cases, by date, stratified into people who were hospitalized and not hospitalized. See the blue column? That’s hospitalizations, over time, for people who have COVID-19. And now I’m going to make my most important point:
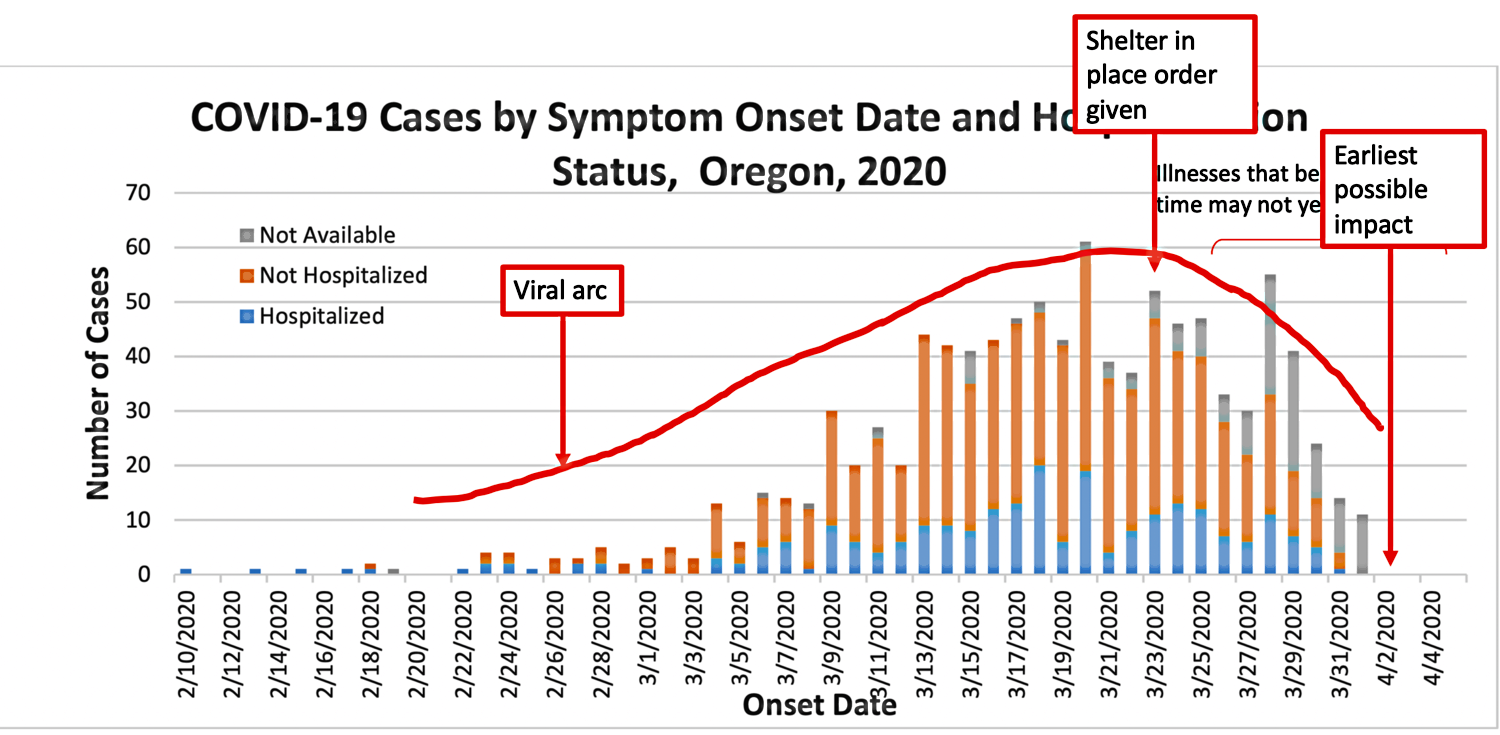
COVID-19 cases were on the decline, following the classic arc of a virus, before the shelter in place orderwas given by Governor Kate Brown on Monday, March 23rd. And, as importantly, the ongoing decline has happened before the shelter in place could have had any impact.
It’s important to understand WHEN we should see the impact of Governor Brown’s 3/23 request for all Oregonians to stay home. At a bare minimum, someone exposed takes 5 days to exhibit symptoms, and 10–13 days (from exposure) to be hospitalized, which means at the very, very earliest, we should start to see a decline in hospitalization from a shelter in place order 10–13 days AFTER the order starts, which would be for the state of Oregon, somewhere between April 2nd and April 5th…so let’s look at that same chart again:
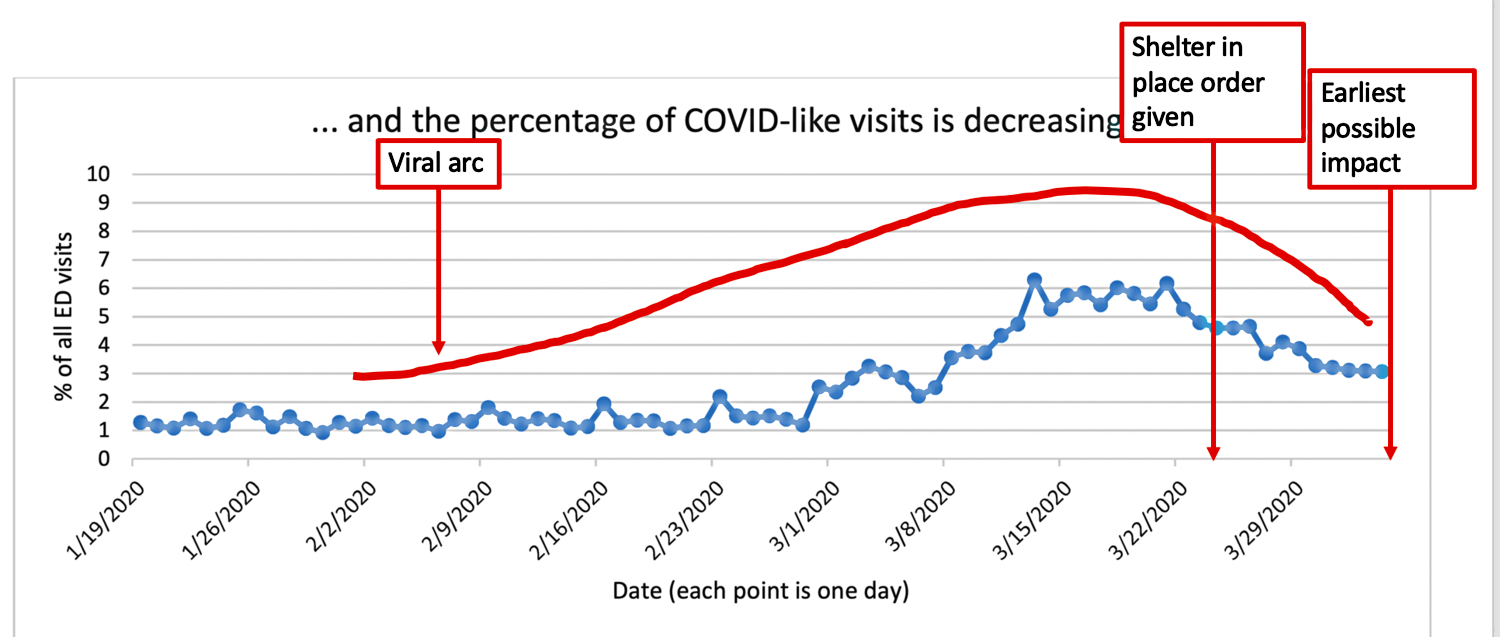
We can see the same phenomenon with a second kind of data provided by Oregon Health Authority, which was also in this morning’s information packet:
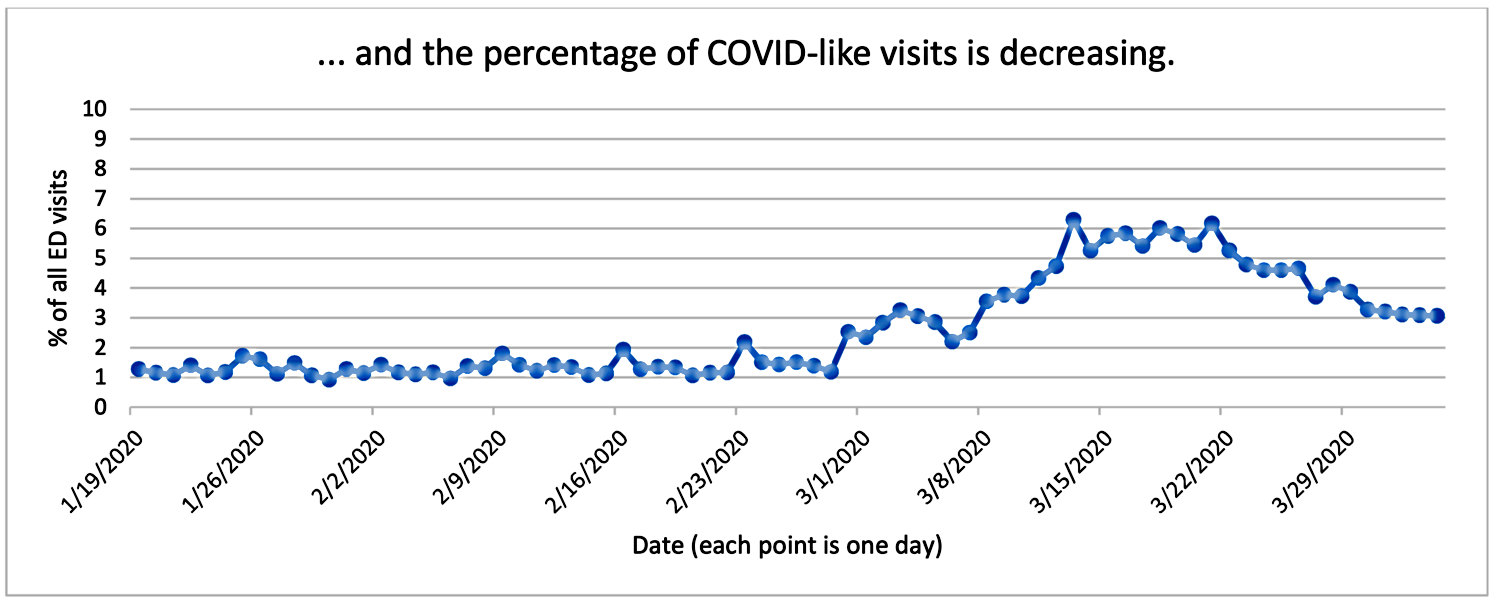
Here, we see the percentage of COVID-like symptoms presented at emergency room visits in Oregon. This doesn’t mean someone has COVID-19, so it’s a bit more of a crude measure, but this number would certainly SPIKE if COVID-19 was spiking. If you check the dates versus the shelter in place order, you see the exact same thing.
In Conclusion
COVID-19 was on the decline before massive economic and societal damage to the state of Oregon through a shelter in place order was delivered on March 23, 2020. The data does NOT support maintaining that order. What data is our Governor relying upon if not the hospitalization data, which tells a clear story?
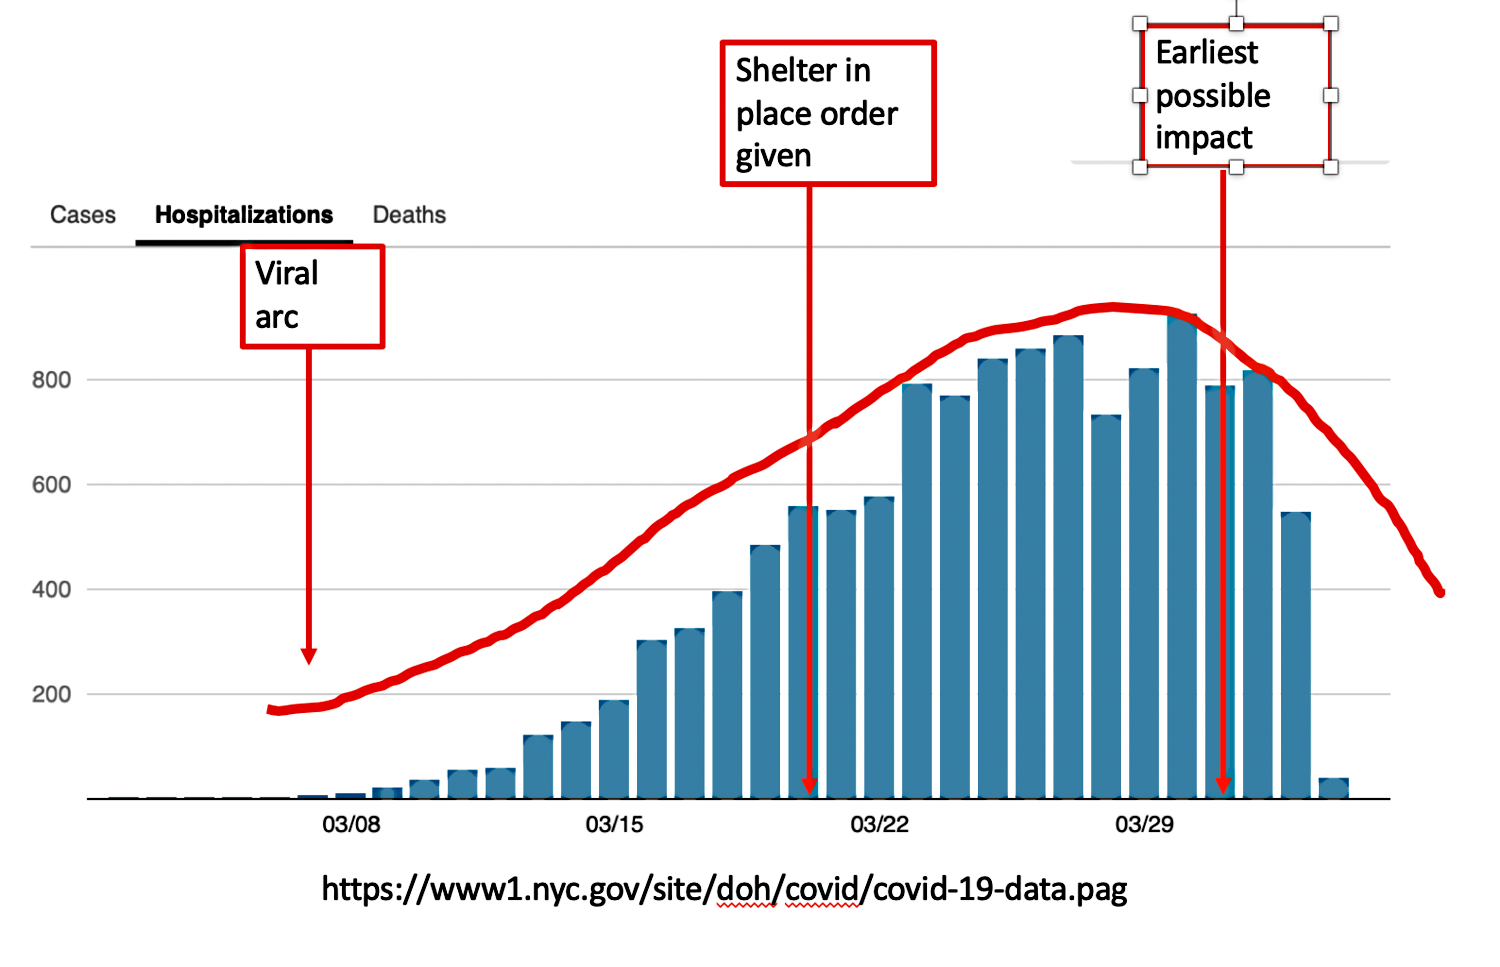
I know, we don’t want Oregon to become the next New York. That’s part of the fear that keeps Oregonians hunkered down and trusting that Governor Brown and the OHA know what they’re doing. So what if I told you that New York’s hospitalizations data looks exactly like ours, but just with bigger numbers (and keep in mind that New York City’s population density of 26,403 versus Oregon’s of 35.6 means any viral illness is going to get a lot more people in New York City)? What if New York was already passing through the natural viral arc long before they, too, got locked down? Here’s their data:
COVID-19 is no joke. If you are over 65 or have co-morbid conditions, self-quarantine makes a ton of sense. Locking down an entire state and causing 20–40% unemployment for a virus that was already on the tail end of its arc? That’s madness. Lift the order, Governor Brown, let Oregonians take appropriate cautions and get back to their lives and livelihoods.
Addendum:
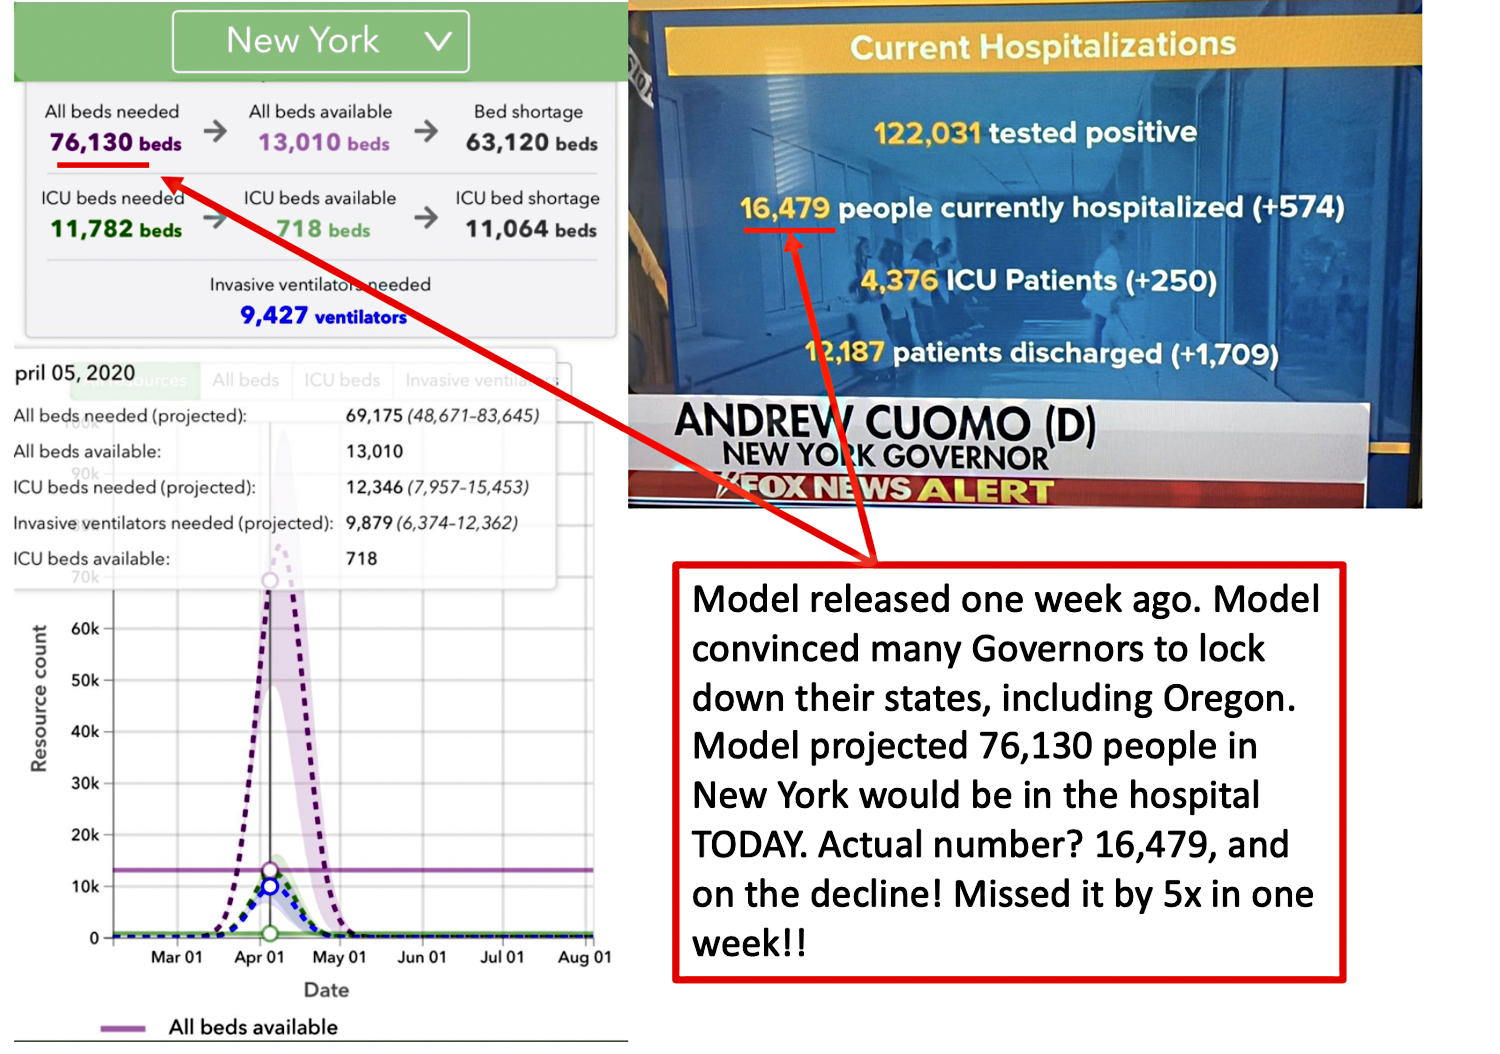
I’ve been asked my opinion for why Governor Brown and OHA could be so wrong about this, there are plenty of smart people at OHA and working for the Governor. I think the explanation is pretty simple: they were motivated to order the lockdown based on a model created by Washington’s IMHE which is proving to be disastrously inaccurate. My own guess is that the model simply assumed far fewer people had already been exposed to the virus than had, and that one assumption can reverberate through a model and make for dire predictions, that aren’t coming true, and each day the IMHE model appears to be more WRONG. Here’s how off the model is for New York right now, and this model was only created one week ago:
Will Governor Brown have the courage to say, “We were wrong, no lockdown needed”? I doubt it.
Addendum 2:
A reader remarked that Oregon’s schools were shut down SOONER than the March 23rd lockdown, which is true. They feel that explains the flattened curve here in Oregon. My response below:
Hi Chris:
The evidence is strong that COVID-19 is spread WITHIN families. The evidence is weak that COVID-19 is spread within schools or by children. Quote:
“If you look, most cases, for example, even in China, are in family clusters. Most secondary cases occur in families,” Dr. Mike Ryan, executive director of the WHO’s health emergencies program, said during a news conference last month. “That’s been driving the epidemic.”
Closing schools and sending people home would RAISE, not lower the primary way this disease is spread. Furthermore, your argument doesn’t explain why New York is ALSO on the back end of the hospitalization curve, and closed their schools much later. Please reconcile.


Truth Comes to Light highlights writers and video creators who ask the difficult questions while sharing their unique insights and visions.
Everything posted on this site is done in the spirit of conversation. Please do your own research and trust yourself when reading and giving consideration to anything that appears here or anywhere else.